GAE(Java) for Google Analytics,感兴趣的可以看看。
来源:http://analytics.blogspot.com/2009/10/google-analytics-api-on-app-engine.html
t’s Friday, time for some fun! Advanced API analytics fun :)
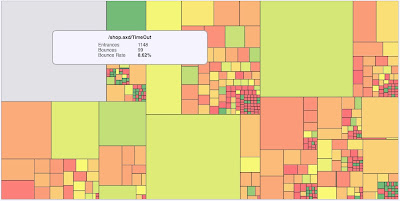
Here is a captivating way to look at your Google Analytics data in a Treemap visualization. You can visualize your own data with our live demo. (Note: IE currently not supported for visualization part.) click to enlarge
And, here is a video explaining how to look at the Treemap visualization and how to use it.
The goal of this example was to teach people how to use the Google Analytics API on App Engine in Java, as well as to demonstrate how to use both OAuth and AuthSub along with the App Engine’s various services. The code looked great, but the output was a boring HTML table. So we used some open source tools to transform the table into a pretty tree map visualization, which is also useful in noticing interesting metrics.
All the code has been open sourced on Google Project hosting. Also, here’s an article describing how this application works making it easy for developers to use this example as a starting point for new data visualizations and other Google Data projects.
For the data retrieval part, we used the App Engine Java SDK and the Google Analytics Data Export API Java Client Library to retrieve data from Google Analytics. The example code implements both unsigned AuthSub and registered OAuth authorization methods allowing developers to get up and running quickly in their dev environment and later switch to a secure authorization method in production environments. The application also uses the Model-View-Controller pattern, making it flexible and allowing developers to extend the code for new applications (e.g. adding support for other Google Data APIs).
And lastly, for the visualization part, we used the open-sourced Protovis SVG Visualization Library to create the Treemap. This JavaScript library is maintained by the Stanford Visualization Group and excels at creating brand new visualizations from a data set (in this case a boring HTML table). To handle all of the interactions, including rollover, tooltips and slider controls, we used JQuery. Here is the JavaScript source for the visualization part of the sample.
Enjoy!
Posted by Nick Mihailovski, Google Analytics API Team p.s. If you have created any cool new visualizations using the Google Analytics Data Export API, so we can highlight them as well.
Google Analytics API on App Engine Treemap Visualization
Google Analytics API on App Engine Treemap Visualization
...